
Creating an engaging annual report can seem like a daunting task. However, a well-crafted annual report is more than just a regulatory requirement; it’s a powerful tool for stakeholder engagement and a chance to tell your organization’s story.
But how can you design a report that truly resonates with your stakeholders and stands out? In this guide, we’ll explore some practical annual report tips and design strategies to make your report both informative and inspiring.
Why an Engaging Annual Report Design Matters
An annual report is often the most comprehensive publication a company produces each year. It’s where you highlight achievements, share future goals, and establish transparency. However, the most successful reports go beyond basic financial disclosures—they effectively communicate impact, build trust, and, most importantly, engage stakeholders. By focusing on annual report stakeholder engagement, you can transform a typically dry document into a dynamic tool that reinforces your brand’s values and vision.
Key Stakeholders of Annual Reports
- Investors and Shareholders: They assess financial health and growth prospects through financial statements, looking for dividends and investment returns.
- Employees and Management: Employees gauge the company’s achievements and stability, while management uses the report for future planning.
- Customers and Clients: Interested in the brand’s values, especially CSR and sustainability efforts, which influence loyalty and trust.
- Suppliers and Partners: They seek signs of financial stability and partnership opportunities for a mutually beneficial relationship.
- Regulatory Bodies: Ensures legal compliance, examining tax, environmental, and employment practices.
- Local Communities: Look for community engagement and CSR efforts to confirm the company’s positive local impact.
- Analysts and Industry Experts: Assess competitive standing and market share to understand industry positioning.
Key Steps for Designing an Engaging Annual Report
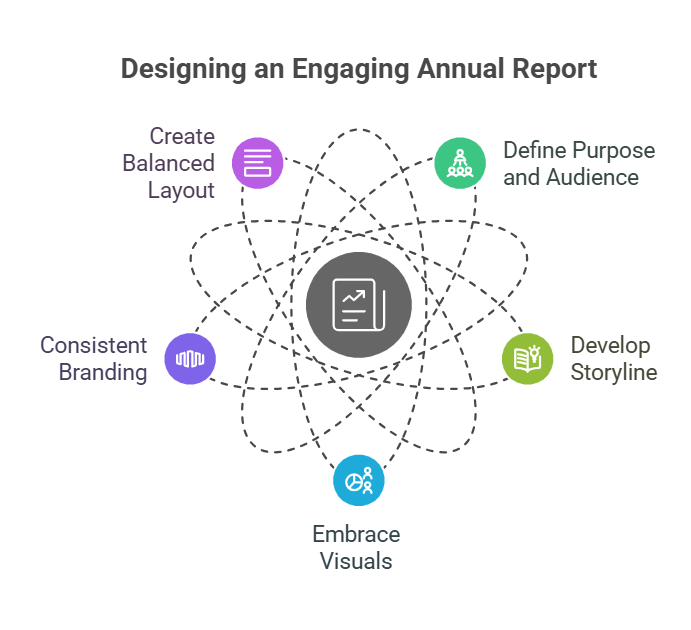
1. Define Your Purpose and Audience
Before diving into design elements, take a step back to define the purpose of your report. Are you focusing on financial transparency? Do you want to emphasise your social impact? Or are you aiming to showcase the innovation within your organisation? Having a clear purpose helps you prioritise content and design elements that align with stakeholder expectations.
Knowing your target audience is equally important. An annual report for investors might focus heavily on financial performance and strategic goals, while a report for customers or employees might emphasise community impact and corporate culture.
2. Develop a Compelling Storyline
A good story engages, and an engaging annual report design is no different. Think of your report as a narrative. Begin with a strong opening message from your CEO or board chair to set the tone and create a connection. You can also include a year-in-review section that highlights significant milestones and accomplishments.
Use storytelling techniques such as case studies, testimonials, and real-life examples. These humanise your report and make it relatable, which can be especially useful for stakeholder engagement.
Essential Elements of a Visual Design Strategy
3. Embrace Visuals and Infographics
Visuals play a crucial role in creating an engaging annual report. Text-heavy pages can be overwhelming, so consider breaking up large sections of text with infographics, charts, and data visualisations. Not only do these elements improve readability, but they also make complex data more accessible.
- Infographics: Use infographics to showcase achievements or complex data points.
- Charts and Graphs: Show trends over time with line graphs, pie charts, or bar graphs.
- Photography: High-quality images of your team, events, or community projects can personalise your report and foster emotional connections.
4. Consistent Branding
Consistency in branding is essential for a cohesive annual report design. Use your organisation’s colours, fonts, and logo throughout the report. A well-branded report builds trust and ensures that your report aligns with other corporate communications. Consistent branding also leaves a lasting impression on stakeholders.
5. Create a Balanced Layout
A clear, well-organised layout helps readers navigate your report easily. Use headings, subheadings, and bullet points to break down content into digestible sections. Try using whitespace to create a clean, modern look, and avoid cluttering the pages with too much information.
Tips for Enhancing Readability and Engagement
6. Focus on Readable Typography
Typography is a key component of annual report design. Choose fonts that are both modern and easy to read. Avoid using too many font styles, as it can make the report look unprofessional. Stick to a font hierarchy that clearly differentiates between headings, subheadings, and body text. This approach will guide readers through the content without overwhelming them.
7. Leverage Digital Formats
With more companies shifting to digital, consider creating a digital version of your annual report. Interactive digital reports allow for multimedia elements, such as videos, clickable infographics, and animated charts, that engage readers more effectively than a traditional PDF or print report. Digital reports are also easier to distribute and can include analytics to track reader engagement.
8. Include Calls-to-Action (CTAs)
While CTAs are common in marketing materials, they are less often seen in annual reports. However, adding subtle calls to action can make your report more interactive. For example, you might include links to a landing page, an invitation to sign up for updates, or a QR code linking to a video message from the CEO.
Balancing Financial and Non-Financial Content
9. Use Transparent Financial Reporting
Transparency is crucial for building trust. Use clear language when discussing financial statements and metrics. Adding visuals, such as financial dashboards, can help simplify complex data, making it easier for all stakeholders to understand.
10. Highlight Social and Environmental Impact
Non-financial information, such as social impact, environmental sustainability, and corporate responsibility initiatives, has become increasingly important for stakeholders. By showcasing your organisation’s impact beyond profit, you can build stronger relationships with both investors and customers who value responsible practices. This also aligns with trends in annual report stakeholder engagement, where companies are expected to share their societal contributions.
Conclusion
Crafting an engaging annual report is about more than just delivering financial data. It’s an opportunity to build a compelling narrative that communicates your organisation’s achievements, values, and vision. By following these annual report tips and prioritising annual report stakeholder engagement, you can create a report that not only meets regulatory requirements but also inspires and connects with your stakeholders.
Remember, the most effective annual reports are those that reflect your organisation’s authenticity and commitment to growth. Design with purpose, clarity, and creativity to make your report a valuable asset for your brand.