
Annual reports contain a lot of data that can become boring if not presented creatively. It is important for any organization to create an impactful and visually appealing annual report. There are a wide range of tools that can help you in achieving that. Today, in this blog, we will discuss annual report design tools for creating awesome annual reports. Each of these tools comes with a unique set of abilities and will definitely enhance your report design.
Top 5 Tools For Annual Report Design
Below are some of the best tools available in the market that you can use to design annual reports. So let’s have a look at them.
1. Adobe InDesign
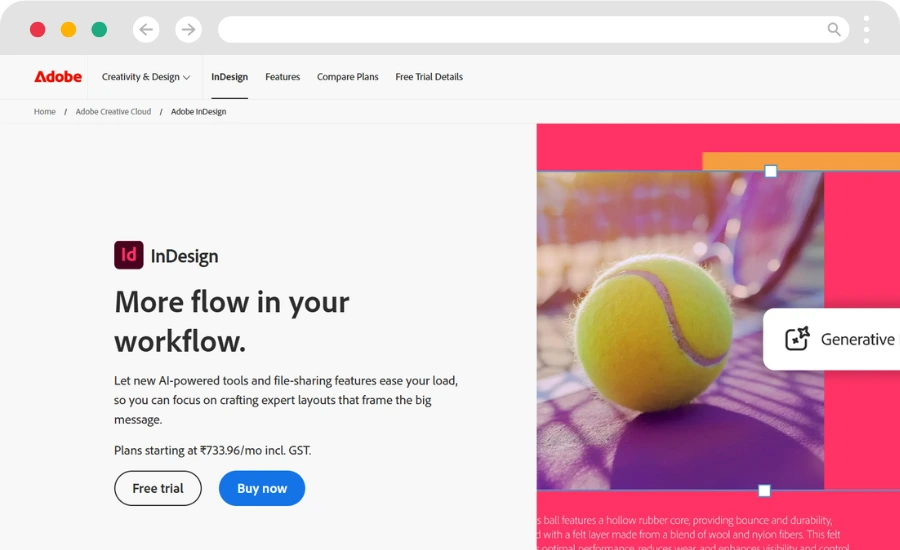
Adobe InDesign is the most famous publishing software used by professionals all around the world. InDesign has lots of features for handling text and images, which makes it an ideal tool for designing annual reports. Moreover, this software is ideal for handling multi-page documents with the help of its typography tools, which makes it a staple for creating high-quality reports.
- Advanced Typography: The InDesign software offers you complete control over the text styling with the help of its powerful typography tools.
- Multi-Page Management: This software is great for managing and organising multi-page documents, which makes it ideal for lengthy reports.
- Integration with Adobe Suite: Being the software from Adobe, it provides easy integration with other Adobe tools, such as Photoshop and Illustrator, for enhanced design capabilities.
2. Canva – One of the Best Annual Report Design Tools
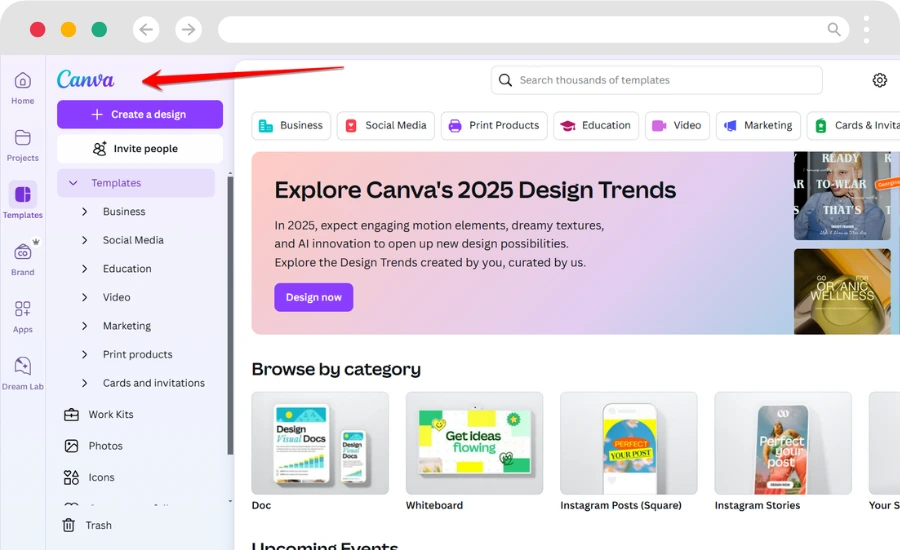
Canva, when it came, revolutionized the design industry. Canva made it easy for non-designers to create and design with its features, making it a powerful and famous tool. The reason why Canva became famous was because of its templates. Canva has millions of templates to cater to the needs of its users. All the user has to do is customise it a little to fit their needs. Above all, Canva is basically a free tool that is good for beginners and small businesses.
- User-Friendly Interface: Canva’s interface can be used easily by people with no prior design experience.
- Template Library: The main feature that makes Canva famous is its library of templates that can be customised to fit your brand.
- Collaborative Tools: As all the data in Canva is stored in the cloud, it provides an opportunity for real-time collaboration among different people.
3. Visme
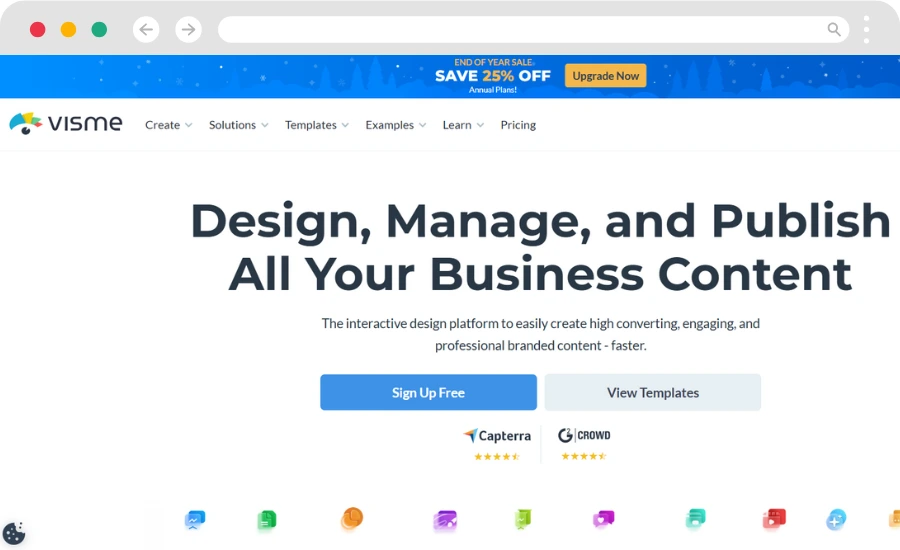
Visme is another famous design software that you can use for annual reports. This tool is easy to use and has powerful design capabilities, allowing users to create visually engaging reports. Moreover, Visme also provides effective integration of charts and graphs that help in presenting complex data clearly.
- Interactive Elements: Visme allows you to add interactive elements such as charts, maps, and videos to reports. This helps increase engagement amongst the readers.
- Customizable Templates: Visme provides a wide range of templates that can be customised to match your brand identity.
- Data Visualization: Visme also provides advanced infographic tools that will help you a lot with data visualisation.
4. Piktochart
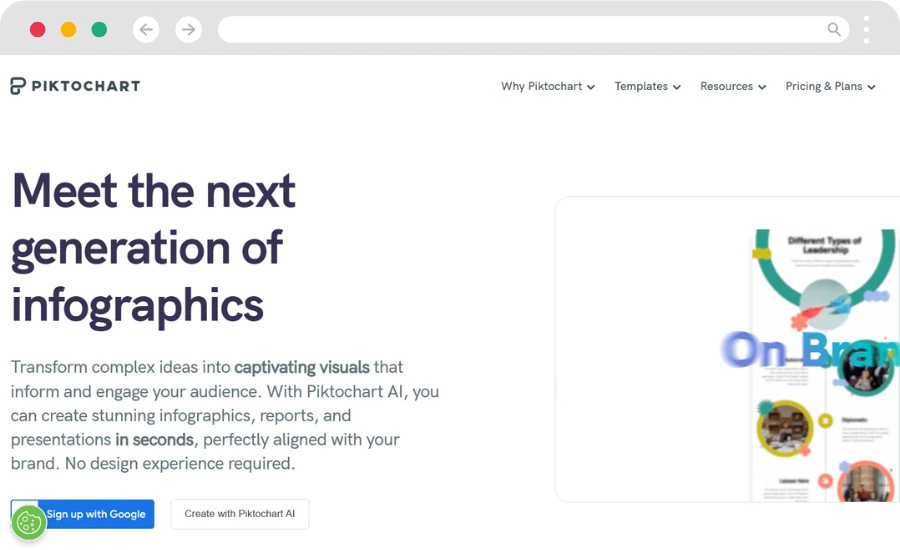
Piktochart is another famous user-friendly design tool in the market. It is a great tool to create infographics, presentations, and reports. You can use this tool to convert data into a visual format, which makes it easier for you to communicate your key points. This software allows you to make reports visually appealing with minimal effort.
- Infographic Creation: This software specialises in creating infographics that can present data in a visually appealing manner.
- Ease of Use: The user interface of Piktochart is one of the easiest you’ll ever use. Its simple drag-and-drop feature will make designing reports straightforward.
- Data Import: Piktochart also allows you to directly import data from a spreadsheet.
5. Marq Formerly Lucidpress
Lucidpress is a web-based design and layout tool. Just like Canva, Lucidpress also offers collaborative features, making it easy for multiple users to work on a single project. Moreover, it also provides templates and design tools that are perfect for creating a professional annual report.
- Collaborative Design: Allows multiple users to work on the same document in real time.
- Template Customization: Pre-designed templates that can be easily customised.
- Cloud-Based: Access your designs from anywhere with an internet connection.
Best Practices For Annual Report Design
Below are some of the best practices that you should follow while preparing an annual report.
Visual Storytelling
While preparing the organisation’s annual report, you can add some storytelling elements to make it more interesting and engaging. You can include case studies, client testimonials, and narratives, which will help the readers remember this information for a long time. Moreover, visual storytelling adds great value to the whole report.
Data Visualization
You should use infographics, charts, and graphs to present your data in a clear and compelling way. Moreover, tools such as Adobe InDesign can help you create custom infographics that will enrich your whole report.
Consistency and Branding
When you’re designing your report, you’ll have to make sure that it is consistent with the company’s branding. You can use a consistent colour scheme, typography, and logo placement throughout the document to achieve this.
Conclusion
So, this was all about the tools that you can use to create annual reports for your organization. These tools will help you a lot in creating engaging and informative reports that will be helpful to all your stakeholders.